My research focuses on topics in visualization, data analytics, and computer graphics driven by real-world challenges. Below is a sample of on-going projects in my research lab. For more information about these projects or others, please contact me. A complete list of publications can be found here.
 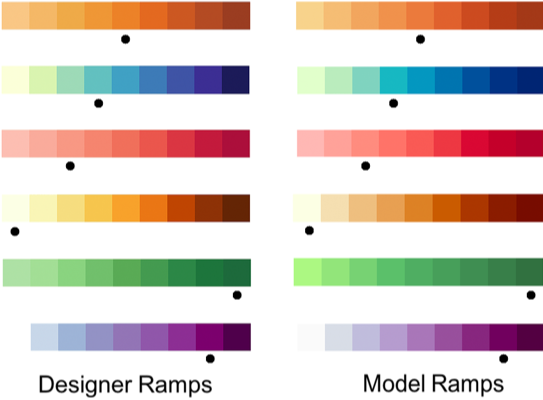 |
Color is commonly used to encode values in a visualization. However, we know little about how the complexities of visualization impact color encoding perception and design. Shape, size, shading, and even viewing device all manipulate the colors that people will see in a visualization, and subsequently their ability to effectively use that visualization. Further, most visualization designers lack sophisticated color science knowledge required to choose the colors they really want to communicate their data. We leverage sampling-based models to better understand and predict how color manifests in different types of visualizations. We embody these models in design support tools to help users more effectively and efficiently generate custom color encodings. Funding: National Science Foundation Recent Publications: |

  |
As the volume of available data increases, analytics systems must leverage automated analysis methods to make sense of data. However, these methods often remove expert knowledge from the analytic process, obscuring important patterns and leveraging black-box statistical methods. In these projects, we explore how visualizations might enable fluid collaboration between analysts and statistical methods to reintegrate people into big data processes. Our systems explore how people might leverage data synthesized across multiple sources, how statistical processes might learn from expert behavior, and how analysts can intuitively provide input into statistical processes. This research also examines how interactive visualizations may help analysts understand the processes underlying machine learning to reduce barriers to its use and interpretation in practice. Funding: National Science Foundation, U.S. Air Force Example Publications: |
 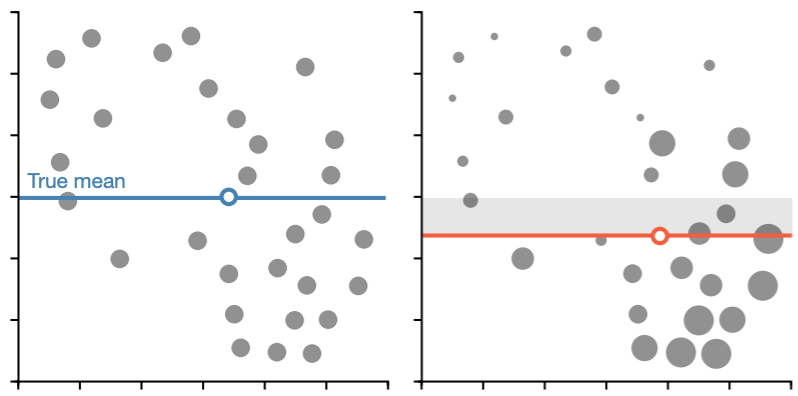 |
Our understanding of visualization design is conventionally based on how well people can compare pairs of points. As people face more and more data, visualization must move beyond small-scale design thinking to understand how design might support people in understanding large collections of datapoints. Drawing from psychology, this work seeks to understand how people draw conclusions about data through visualizations and how visualizations might be designed to better support these judgments. The results from these efforts have driven scalable systems in domains ranging from biology to the humanities. Funding: National Science Foundation Example Publications: |
  |
Visualization aims to make data more accessible; however, visualization designs assume a common model "user" with conventional skills and abilities. Variations in physical, visual, or cognitive ability may introduce substantial challenges to engaging with data visualizations. We use a combination of qualitative and quantitative methods to identify challenges to data access and propose alternative design guidance to reduce the resulting barriers. We focus on cognitive disability, where variations in working memory, mathematical reasoning, and attention impact data sensemaking. Funding: Department of Health & Human Serives, National Institutes of Health Example Publications: |
  |
The space of consumer display technologies is evolving rapidly. This provides people with access to displays of different shapes, sizes, and capabilities, such as mobile phones, HMDs, and smartwatches. New displays afford new opportunities for analytics tools that help people make sense of our increasingly data-driven world. This project looks at how people perceive and interact with visual information with different display technologies, with a special emphasis on immersive analytics (e.g., visualizations in augmented reality) and data physicalization (e.g., visualizations using physical media). We develop guidelines, techniques, and tools that effectively leverage the capabilities of these technologies to enhance the ubiquity, accessibility, and effectiveness of data analytics and immersive visual applications. Funding: National Science Foundation, NREL, National Institutes of Health, University of Colorado Innovative Seed Program Example Publications: |